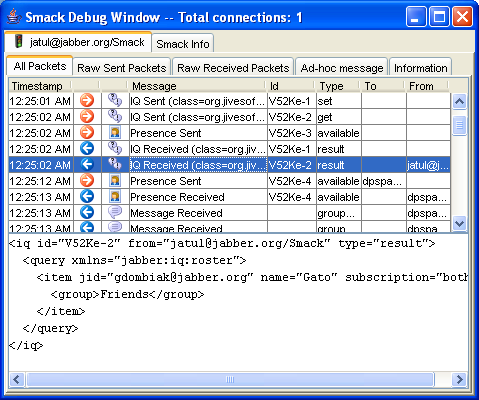
 When debugging mode is enabled, a debug window will appear containing tabs for each new created connection. The window will contain the following information:
Smack includes two built-in debugging consoles that will let you track all XML traffic between the client and server. A lite debugger and an enhanced debugger contained in smack-debug.jar, and a console debugger in smack-core.jar.
Debugging mode can be enabled in two different ways:
SmackConfiguration.DEBUG = true;
smack.debugEnabled to true. The system property can be set on the command line such as:java -Dsmack.debugEnabled=true SomeApp
If you wish to explicitly disable debug mode in your application, including using the command-line parameter, add the following line to your application before opening new connections:
SmackConfiguration.DEBUG = false;
Smack uses the following logic to decide the debugger console to use:
smack.debuggerClass. If you need to develop your own debugger, implement the SmackDebugger interface and then set the system property on the command line such as:java -Dsmack.debuggerClass=my.company.com.MyDebugger SomeApp
If step 1 fails then Smack will try to use the enhanced debugger. The file smack-debug.jar contains the enhanced debugger. Therefore you will need to place the jar file in the classpath. For situations where space is an issue you may want to only deploy smack-core.jar in which case the enhanced and lite debugger won't be available, but only the console debugger.
The last option if the previous two steps fail is to use the console debugger. The console debugger is a very good option for situations where you need to have low memory footprint.
 When debugging mode is enabled, a debug window will appear containing tabs for each new created connection. The window will contain the following information:
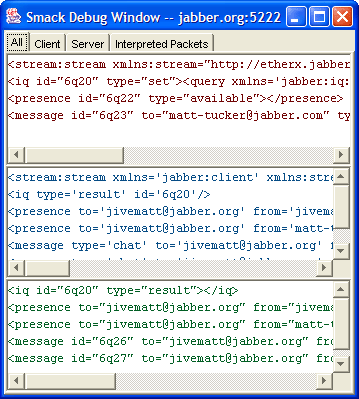
 When debugging mode is enabled, a debug window will appear when each new connection is created. The window will contain the following information:
Copyright (C) Jive Software 2002-2008